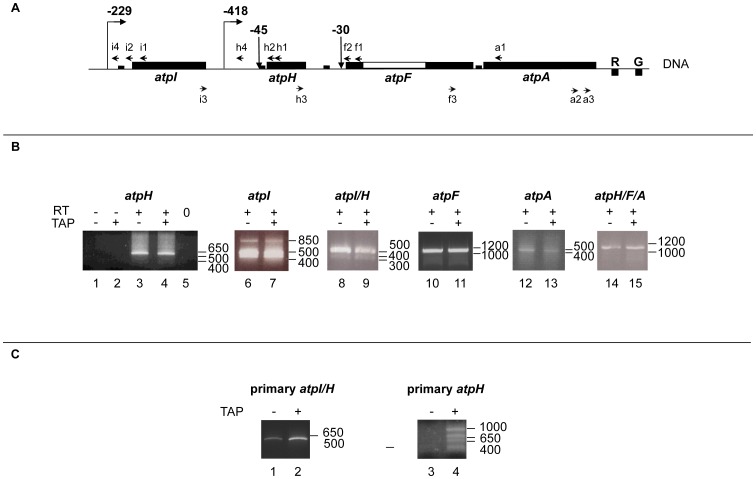
Figure 1. Mapping of transcript ends generated from the large atp operon in Arabidopsis chloroplasts.
A. Schematic presentation of the atpI/H/F/A operon structure. Filled thick boxes correspond to coding sequences of the atp and trn (R and G) genes that are present on opposite DNA strands. The empty box corresponds to the atpF intron. The small filled rectangles correspond to the sRNAs [3], [4]. Upward (with right tip) and downward arrows indicate the 5′ end positions of primary and processed transcripts, respectively, with negative numbers corresponding to the distance from the ATG as described [7]. Left and right-directed arrow heads correspond to primers for the cRT-PCR analysis. B. Mapping of processed atp transcript ends by cRT-PCR. Agarose gels showing the cRT-PCR data are presented, with the positions of the molecular weight markers on the right. For atpH transcripts (lanes 1–5), h1 was used as RT-primer and h2–h3 as PCR-primers. For atpI transcripts (lanes 6–7), i1 was used as RT-primer and i2–i3 as PCR-primers. For atpI/H transcripts (lanes 8–9), i1 was used as RT-primer and i2–h3 as PCR-primers. For atpF transcripts (lanes 10–11), f1 was used as RT-primer and f2–f3 as PCR-primers. For atpA transcripts (lanes 12–13), a1 was used as RT-primer and a1–a3 as PCR-primers. For atpH/F/A transcripts (lanes 14–15), h1 was used as RT-primer and h2–a2 as PCR-primers. 5′ processed transcripts were distinguished from primary mRNAs because PCR products were also obtained in absence (-TAP) of a previous TAP-treatment of the RNA samples. The -RT (lanes 1 and 2) and -PCR (lane 5) controls are shown only for the mono-cistronic atpH mRNAs. C. Mapping of primary atp transcript ends by cRT-PCR. For atpI/H transcripts (lanes 1–2), i1 was used as RT-primer and i4–h3 as PCR-primers. For atpH transcripts (lanes 3–4), h1 was used as RT-primer and h4–h3 as PCR-primers.

