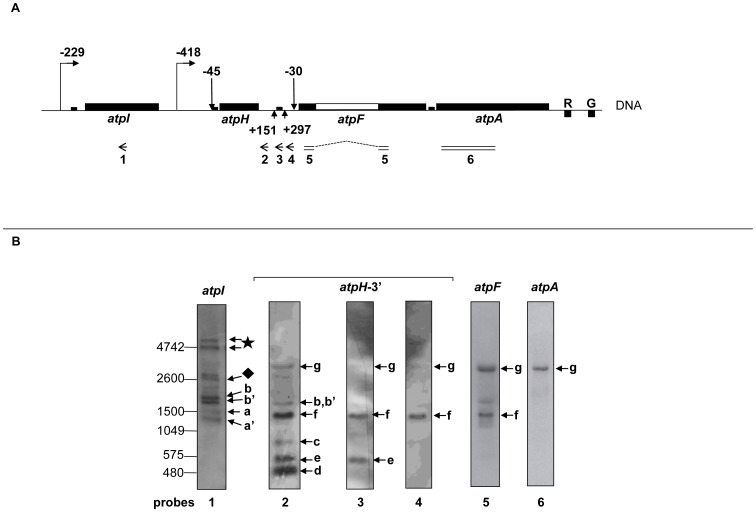
Figure 2. Northern blot analyses of transcripts generated from the large atp operon in Arabidopsis chloroplasts.
A. Schematic presentation of the atpI/H/F/A operon structure is as described in Figure 1A. Upward arrows indicate the position of 3′ ends of the atpH transcripts from the corresponding stop codon (+151 and +297), on the bases of the circular RT-PCR data obtained in this manuscript. Left arrows (1 to 4) and double lines (5 and 6) correspond to single and double strand DNA probes, respectively, which are used in the Northern blot analysis. The probe 5 was designed to detect only the spliced form of atpF transcripts. B. Northern blot analyses of the atp transcripts. The analysis was performed on total RNA using atp gene-specific probes (1 to 6). The multiple transcript isoforms are indicated with letters (corresponding to transcripts in Figure 3A) or symbols (diamond, star). The positions of the molecular weight markers are indicated on the left of the agarose gels.

