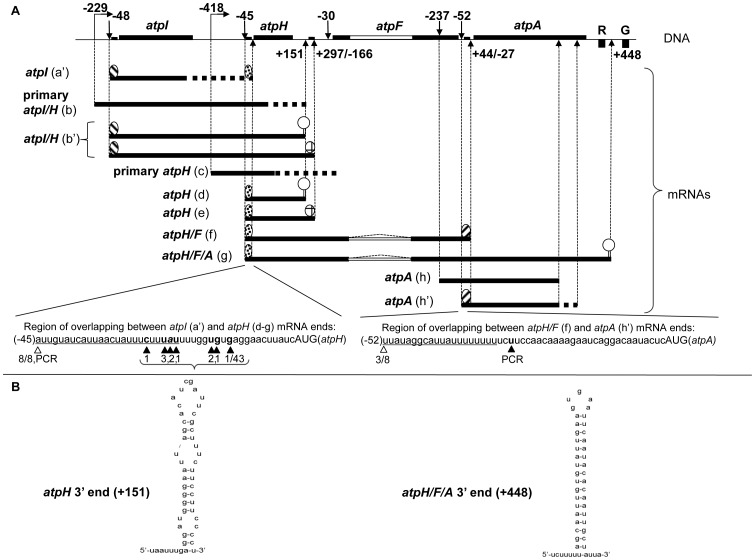
Figure 3. Schematic presentation of the atpI/H/F/A operon and the encoded transcripts.
A. Top panel: the schematic presentation of the atpI/H/F/A operon is as in Figures 1A and 2A. Downward and upward arrows indicate the position of 5′ and 3′ ends of the atp transcripts, respectively, on the bases of cRT-PCR (this manuscript) and primer-extension data [7]. For the 3′ ends of the atpI/H (b′), atpH (e) and atpH/F (f) mRNAs, both the distance from the corresponding stop codon and from the start codon of the downstream cistrons is indicated. Middle panel: transcripts are labeled by letters as in Figure 2B. The thick continuous lines correspond to atp transcripts containing defined ends; the discontinuous lines of the (a′, b, c and h′) atp mRNAs indicate the presence of dispersed 3′ ends. Distinct RNA-binding proteins that are likely involved in definition of transcript ends are depicted as circles with different fillings. 3′ ends that are likely protected by stem-loop structures are depicted as stem loops. The triangle (dotted line) within the atpF mRNA indicate splicing of the intron. Bottom panel: the sequence of overlapping regions between atp transcript ends is indicated. The numbers below empty or full arrowheads correspond to the ratio of the clones displaying a specific 5′ or 3′ transcript end, respectively. The term “PCR” indicates when sequencing was performed directly on the PCR product. The sequence corresponding to the sRNAs, as reported in [3], [4] is underlined. B. Structure prediction of atp mRNA 3′ ends lacking sRNAs. Linear RNA folding at 25°C of the last 50 nucleotides of the atpH transcripts with a 3′ end at position +151 (left panel, ΔG = −14.36 kcal/mol) and of the atpH/F/A transcripts with a 3′ end at position +448 (right panel, ΔG = −29.49 kcal/mol).

