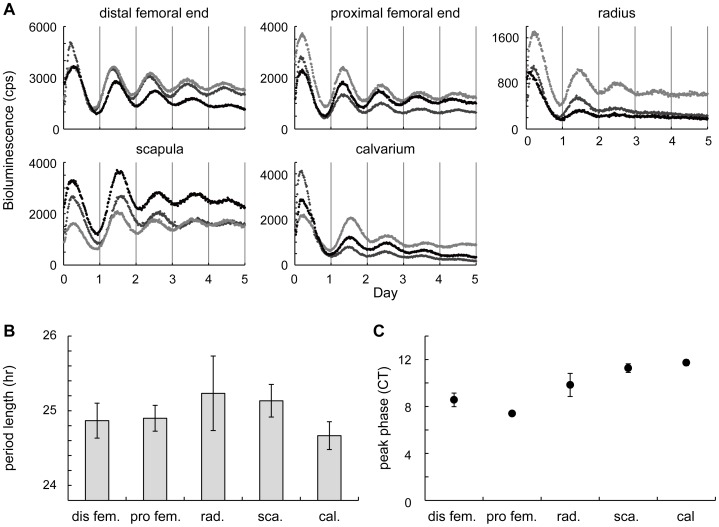
Figure 2. Circadian clocks in different bone tissues.
(A) Bioluminescence circadian rhythms obtained from the distal femoral end, proximal femoral end, radius, scapula, and calvarium. Color dots (light gray, gray and black) indicate traces from three independent samples. (B–C) The quantitative analysis of circadian bioluminescence rhythms. The period length (B) and bioluminescence peak phase (C) are shown (mean ± SEM, n = 3). For peak phase calculation, CT0 was set as a start time of the measurement. CT: Circadian time; dis fem: distal femoral end; pro fem: proximal femoral end; rad: radius; sca: scapula; cal: calvarium.

