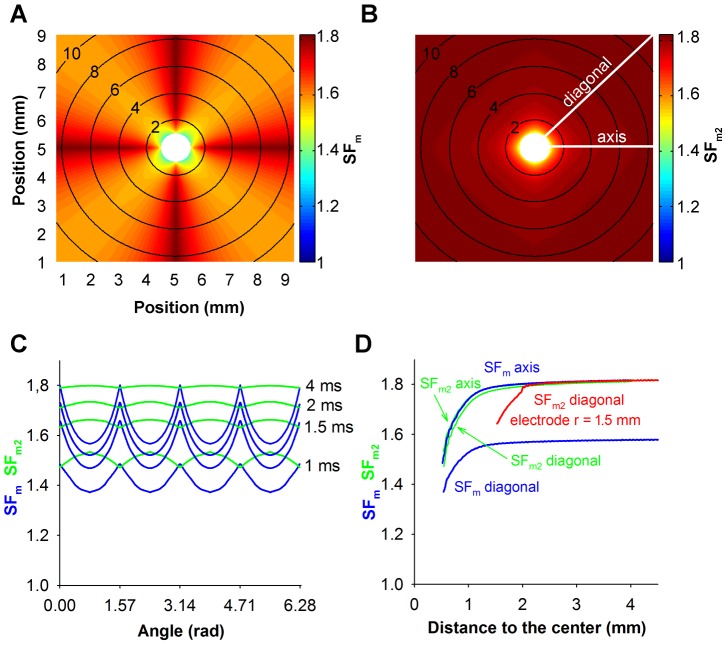
Figure 1. Comparison between SFm and enhanced SFm2 formulation of the safety factor.
Excitation waves were generated in an isotropic tissue stimulated with a 0.5(white colored) at the center of the tissue. A and B: Activation sequences are represented by isochrones (black lines, numbers indicate the instant of activation in ms) and the safety factor computed using SFm (A) and SFm2 (B) is color-coded. Tissue boundaries were not shown for the sake of clarity. C: SFm (blue lines) and SFm2 (green lines) as a function of the angular coordinate along the wavefront in the control tissue at four instants, 1 ms, 1.5 ms, 2 ms and 4 ms after the onset of the simulation. D: Evolution of the SFm (blue lines) and SFm2 (green lines) with distance to the center of the electrode in the diagonal and in the horizontal axis of the tissue (see white lines in Figure 1B). The evolution of the SF2m with distance to the center of the electrode in the diagonal of the tissue stimulated with a 1.5 mm radius circular shaped electrode has also been included (red lines).

