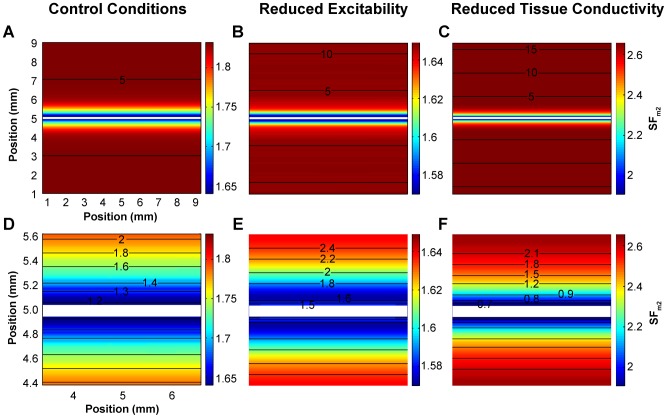
Figure 2. Activation sequence and distribution of the safety factor in planar waves.
Excitation waves were generated in an isotropic tissue stimulated with a 10×0.1 mm electrode (white colored) at the center of the tissue that spanned the entire width of the preparation. Consequently the source-sink relationship was constant along the entire length of the electrode. Activation sequences are represented by isochrones (black lines, numbers indicate the instant of activation in ms) and the safety factor is color-coded in all panels. Bottom panels are zooms of top panels. A and D: control conditions; B and E: reduced excitability (50% reduction of the maximum sodium conductance (gNa)); and C and F: reduced tissue conductivity (75% tissue conductivity reduction). Tissue boundaries were not shown for the sake of clarity. Under all conditions no curvature developed during propagation.

