
Figure 8. Effect of the electrode length, membrane excitability and tissue conductivity on the safety factor.
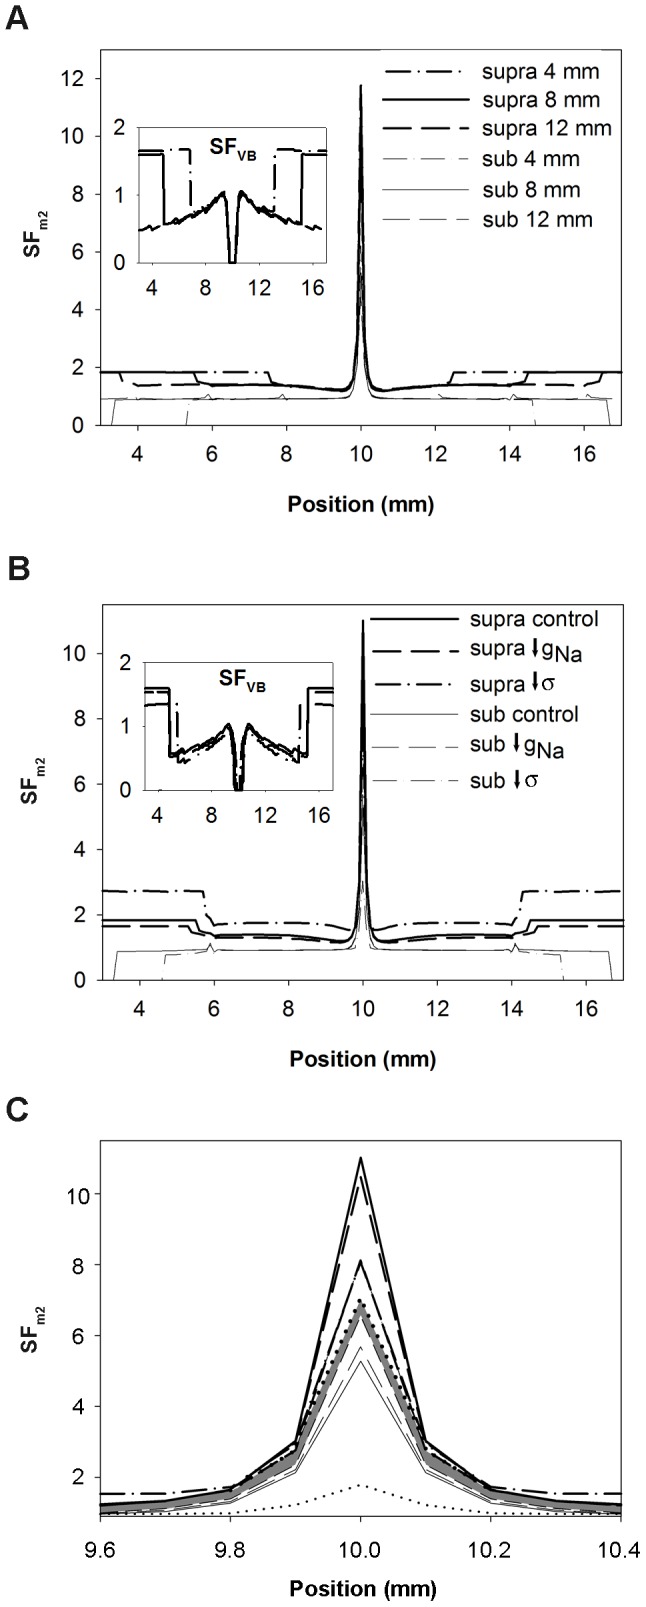
Safety factor profiles obtained with the safety factor formulation SFm2 for suprathreshold (thick lines) and subthreshold (thin lines) amplitudes close to the threshold are represented. A: 4 mm (dashed dotted lines), 8 mm (solid lines) and 12 mm (dashed lines) electrode size, the inset shows the SFVB profiles for comparison; B: control (solid lines), 50% reduction of the maximum sodium conductance (gNa) (dashed lines) and 75% reduction of tissue conductivity (σ) (dashed dotted lines), the inset shows the SFVB profiles for comparison; and C: control (solid lines), 50% reduction of the maximum sodium conductance (gNa) (dashed lines) and 75% reduction of tissue conductivity (dashed dotted lines), 70% reduction of gNa (short dashed lines) and 87.5% reduction of tissue conductivity (dotted lines). The shaded profile indicates the critical safety factor obtained with our formulation (SFm2).