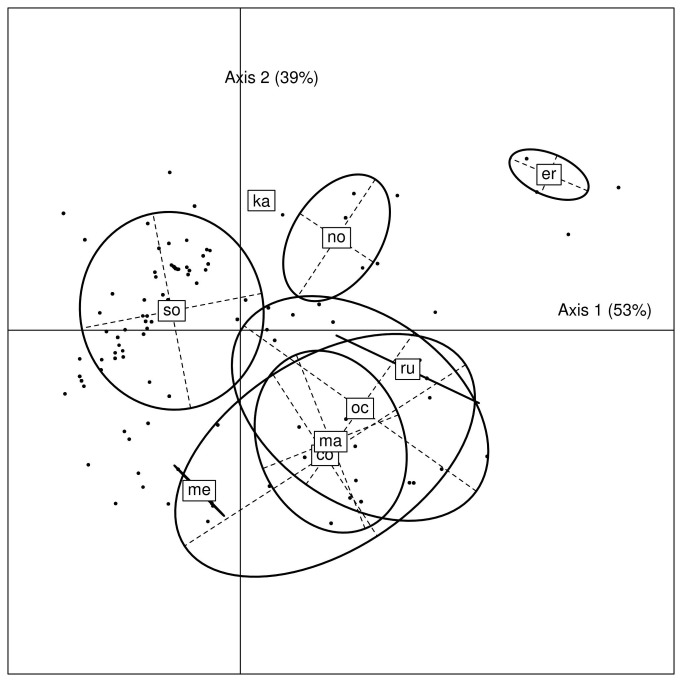
Figure 6. Projection of individual ticks on the first factorial plane of a Linear Discriminant Analysis.
All ticks collected in the same location project to the same point. The percentages along the axes labels are the proportions of between-species variance explained by the corresponding linear discriminant. Units have no meaning. The labels indicating each species are located at the center of the individual points belonging to that species. Ellipses encompass around 66% of the distribution of each species.
Abbreviations: so: O. sonrai, co: O. costalis, ma: O. marocanus, oc: O. occidentalis, me: O. merionesi, ka: O. kairouanensis, er: O. erraticus, no: O. normandi, ru: O. rupestris.

