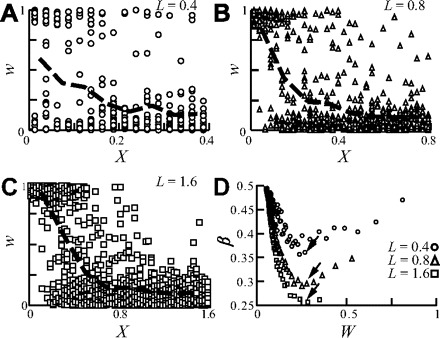
FIG. 2.

The balance of the synaptic weight distribution is reduced for electrotonically longer dendrites. A–C: synapses were uniformly distributed over the cylindrical dendrite with L = 0.4 (A), L = 0.8 (B), and L = 1.6 (C). Synaptic weights at steady state are plotted against distance from the soma; heavy dashed line depicts the average synaptic weight, computed per 0.1 λ bins. Note the steeper decline of the average weight as L increases. Input rate is 13, 8, and 5 Hz for A, B, and C, respectively. D: β as a function of the mean synaptic weight, W. Each dot results from a different simulation, with a distinct input firing rate (4–60 Hz) resulting in different mean synaptic weight following STDP (see methods). As L increases, the curves reside one below the other (and in particular the minimum value of β decreases, arrows), implying that “the problem” becomes more severe when L increases.
