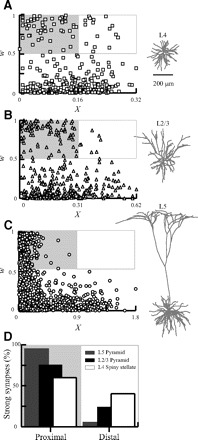
FIG. 4.

STDP in modeled reconstructed neurons. The unbalanced weight distribution at steady state following STDP is shown in L4 (A) cortical spiny stellate cell, in L2/3 pyramid neuron (B), and in L5 pyramid neuron (C). Presynaptic rate in each tree was chosen so that W was similar in all trees at steady state (0.30, 0.29, and 0.29 for A, B, and C, respectively). The proximal region with strong synapses (X/L < 0.5; w > 0.5) is marked by gray rectangle and the distal region with strong synapses (X/L > 0.5; w > 0.5) is marked with white rectangle. D: percentage of strong (w > 0.5) proximal or distal synapses out of the total strong synapses averaged over multiple simulation runs (n = 30) of each of the neuron models A–C (background as in A–C). The percentage of strong synapses in the proximal region is 95, 75, and 60% for L5, L2/3, and L4 spiny stellate, respectively.
