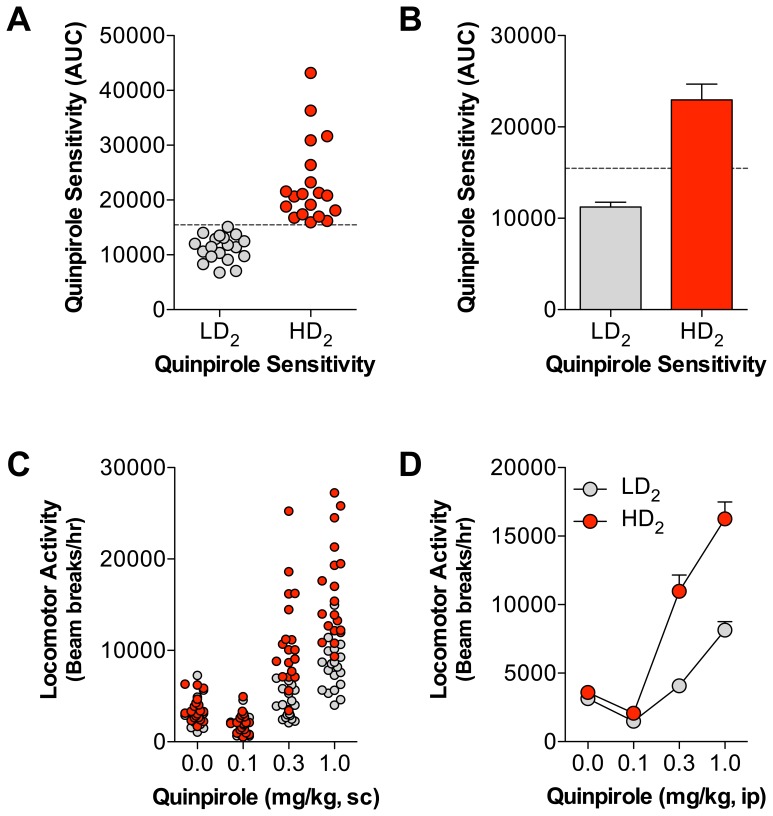
Figure 1. Distributions and averages of quinpirole-induced locomotor activity for LD2 and HD2 groups.
(A) Group distributions of the calculated quinpirole area under the curve (AUC) scores used to classify rats into the LD2 and HD2 groups. The dotted line represents the median score (M = 15460). (B) Group averages (± sem) of the quinpirole AUC score used to generate the LD2 and HD2 groups. The dotted line represents the median score (M = 15460). (C) Distribution of locomotor activity scores (beam breaks/hr) during the ascending within-session quinpirole dose response testing within the LD2 (gray circles) and HD2 (red circles) groups. (D) Group averages (± sem) of the quinpirole dose response curve for the LD2 and HD2 groups.

