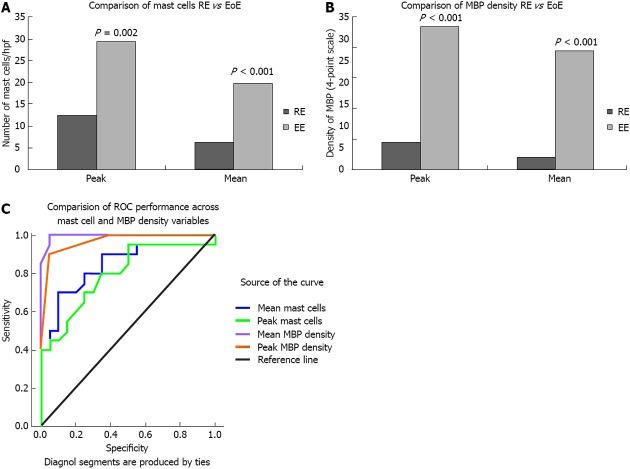
Figure 2.
Biomarker comparison between high eosinophil and low esophageal density. A: Comparison of mast cells reflux esophagitis (RE) vs eosinophilic esophagitis (EoE); B: Comparison of major basic protein (MBP) density RE vs EoE; C: Comparison of receiver operating characteristic (ROC) performance across mast cell and MBP density variables.

