Figure 8.

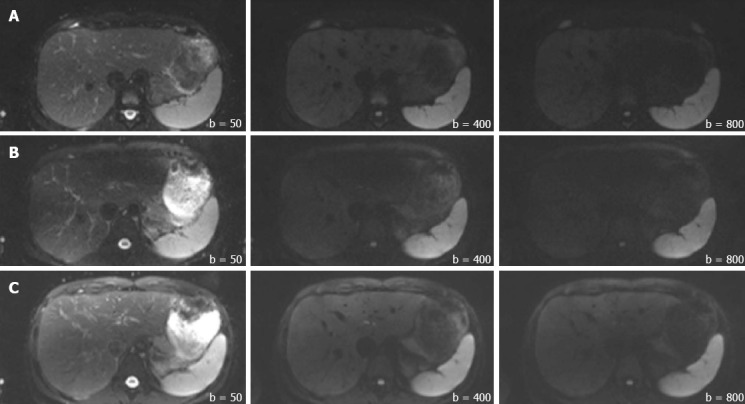
Representative images from the volunteers in the 1.5T (Row A), non-dpTX 3.0T (Row B), and dpTX 3.0T (Row C) scanners. From left to right within each row, b-values increase from 50, 400, to 800 s/mm².

Representative images from the volunteers in the 1.5T (Row A), non-dpTX 3.0T (Row B), and dpTX 3.0T (Row C) scanners. From left to right within each row, b-values increase from 50, 400, to 800 s/mm².