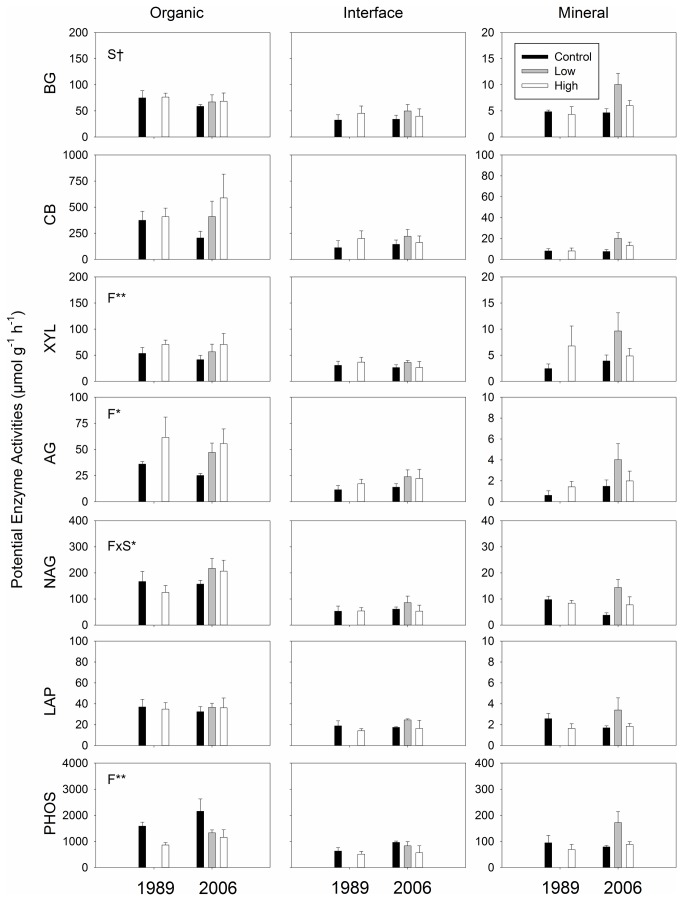
Figure 2. Potential enzyme activities in the three soil profiles, incubated at 15 °C.
The scales of y-axes for organic and interface soils are identical. Statistically significant effects found by mixed-effect ANOVA are shown in panels: F; fertilization treatment (control, low and high fertilizations), S; site (i.e., 1989 and 2006 sites), and F×S; interaction between F and S. Symbols indicate: †; p ≤ 0.10, *; p ≤ 0.05, **; p ≤ 0.01.

