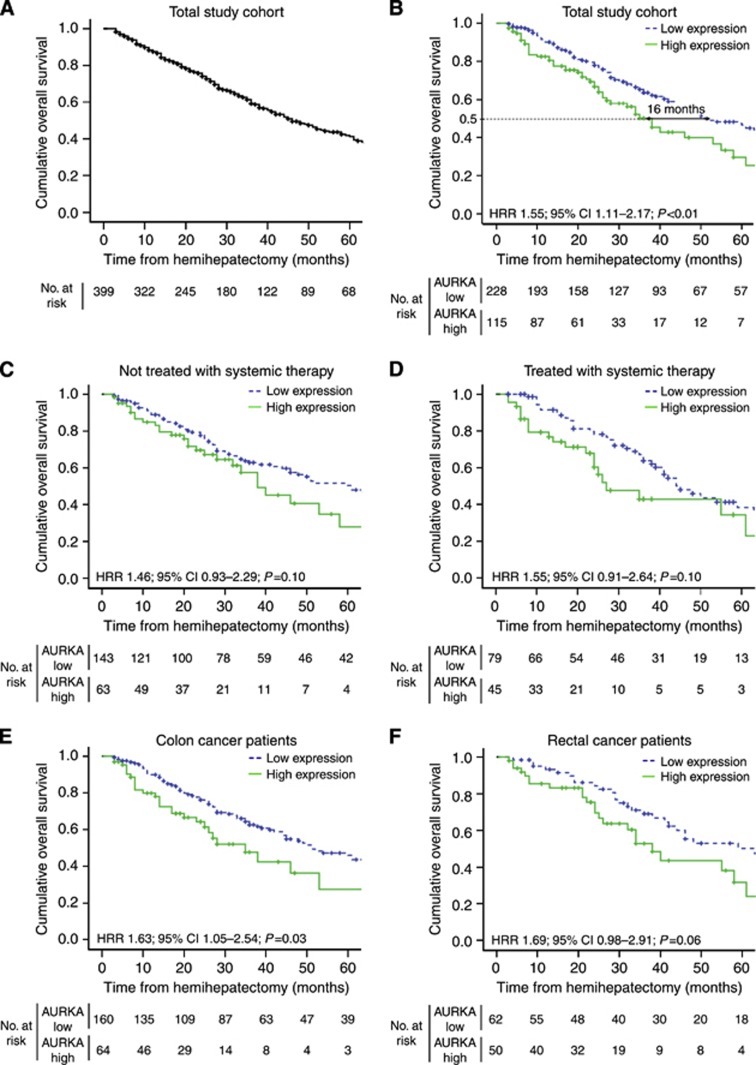
Figure 2.
(A) Kaplan–Meier graph depicting OS in months of the total study population. (B–F) Kaplan–Meier graphs depicting OS in months stratified by intensity of AURKA expression in hepatic metastases (B) of the total population, (C) of patients in whom liver metastases were not treated with systemic therapy (n=206), (D) of patients in whom liver metastases were treated with systemic therapy (n=124), (E) originating from colon cancer (n=224) and (F) originating from rectal cancer (n=112). Information of systemic therapy was unavailable for n=13 patients. Origin of primary tumour (colon or rectum) was unkown for n=7 patients.

