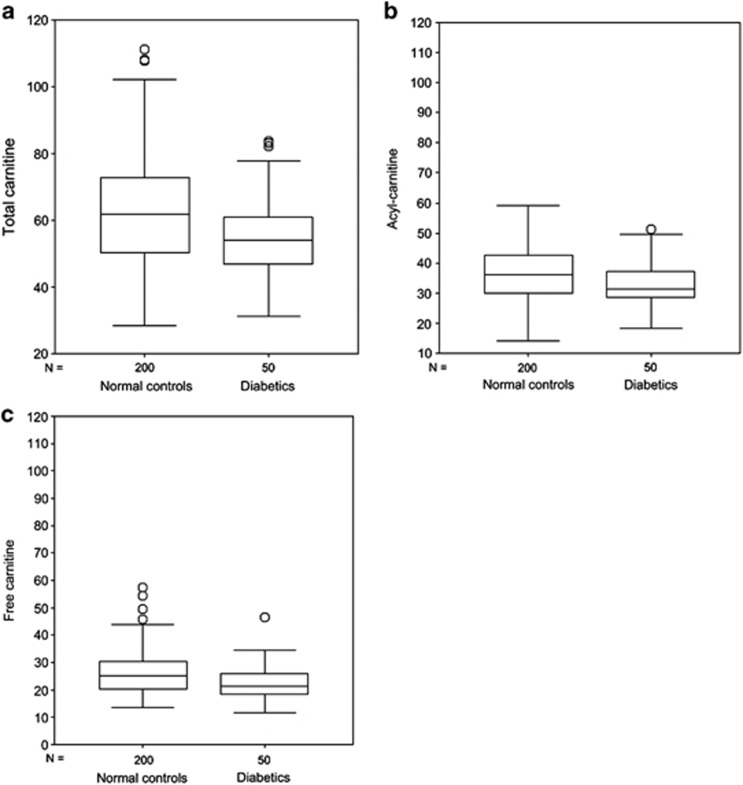
Figure 1.
Box-plot of total carnitine (a), acyl-carnitine (b) and free carnitine (c) in newborns who developed T1D and in controls. The horizontal line across the box represents the median, and the box comprises 50% of the patients, an half lower and half higher than the median; vertical lines represent about the higher and the lower 25% of the patients (circles are the extreme values).

