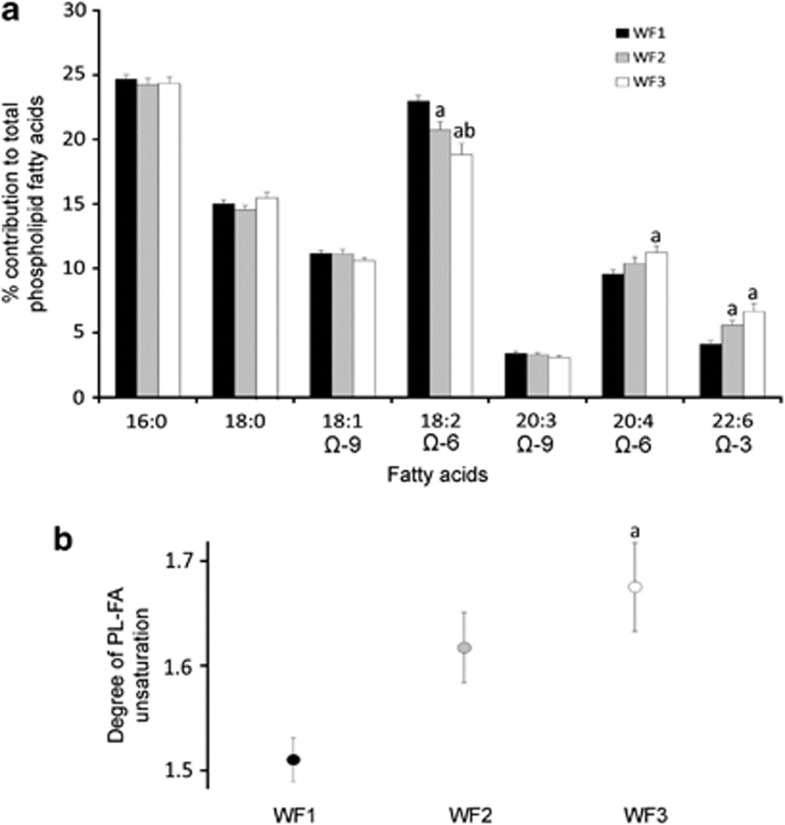
Figure 2.
(a) Per cent contribution of individual fatty acids to total phospholipids (%PL-FA) and (b) degree of unsaturation (DU) of PL-FA measured in WF1, WF2 and WF3 food consumption groups. Only fatty acids accounting for >2% of total PL-FA are presented. Values are means±s.e. a, significantly different from WF1; and b, significantly different from WF2.

