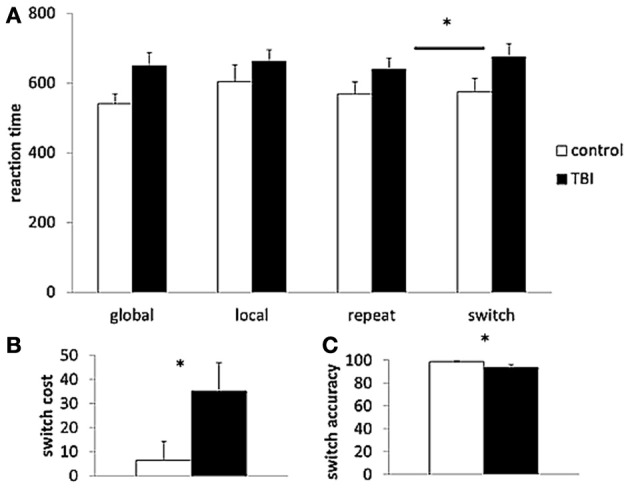
Figure 3.

Behavioral task performance. (A) Reaction time of the different trial types (global, local, repeat, switch); (B) switch cost; and (C) accuracy rate of the Local Global Task. TBI, black bars; control, white bars. *p < 0.05 for the TBI group compared to controls; TBI, traumatic brain injury.
