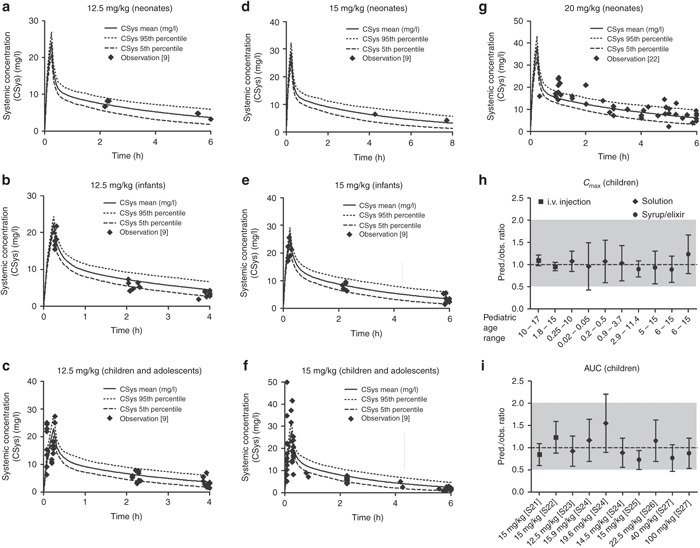
Figure 3.

Observed vs. predicted plasma concentration profiles of acetaminophen (APAP) following (a,b,c) 12.5 mg/kg, (d,e,f) 15 mg/kg, or (g) 20 mg/kg of 15 min intravenous (i.v.) infusion of APAP in different pediatric age groups. Symbols represent individual observed data digitized from literature.9,22 The solid, dashed, and dotted lines represent the predicted mean and 5 or 95% confidence interval of the current physiologically based pharmacokinetic (PBPK) model at respective doses and age ranges. Additional qualification of PBPK model performance in children was conducted by comparing prediction (pred.)/observtation (obs.) ratios of (h) mean peak plasma concentration (Cmax) and (i) mean area under the curve (AUC) following i.v. and oral administrations of APAP from various clinical studies in pediatric subjects at respective doses and age ranges. The dashed line represents line of identity (pred./obs. ratio = 1); the gray shade represents 0.5–2.0 ratio window. Literature sources are presented in Supplementary Material 2 online.
