
Figure 2.
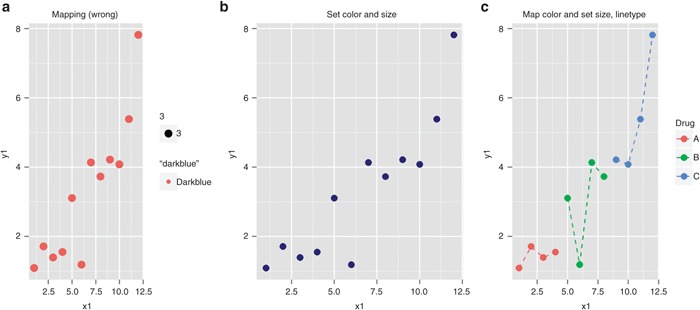
Mapping and setting aesthetics in ggplot2. (a) Variables that are not in the data set are mapped to color and size inside aes, which creates new factor variables on the fly and produce a plot with unwanted legends. (b) Correct settings for color and size. (c) Map the levels of the “drug” variable to color and set size and line type in separate geom calls.