
Figure 6.
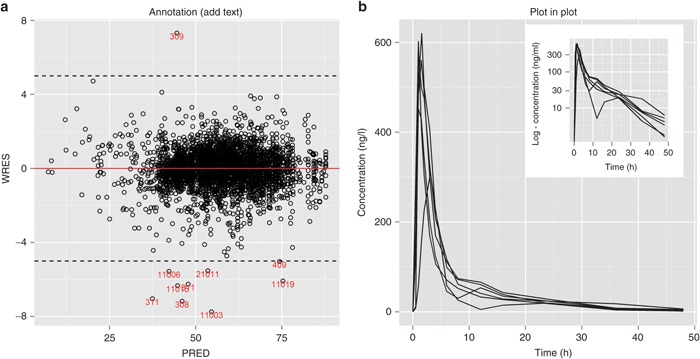
Annotations in plots. (a) Add text (labels) layer for outlier points; (b) new annotation function annotation_custom(): insert an image (semilog scale plot) into the original plot (normal scale).
Official websites use .gov
A
.gov website belongs to an official
government organization in the United States.
Secure .gov websites use HTTPS
A lock (
) or https:// means you've safely
connected to the .gov website. Share sensitive
information only on official, secure websites.
Annotations in plots. (a) Add text (labels) layer for outlier points; (b) new annotation function annotation_custom(): insert an image (semilog scale plot) into the original plot (normal scale).