
Figure 7.
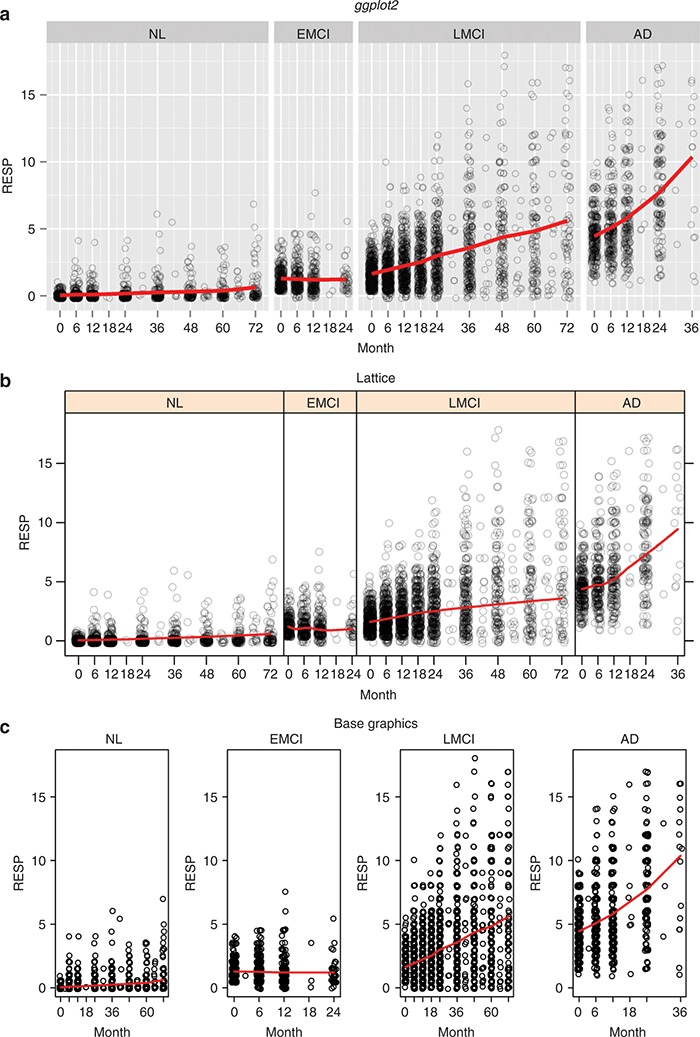
Same plots using ggplot2, lattice, and base graphics. (a) ggplot2, (b) lattice, and (c) base graphics. AD, Alzheimer's disease; EMCI, early mild cognitive impairment; LMCI, late mild cognitive impairment; NL, normal elderly; RESP, response.