
Figure 4.
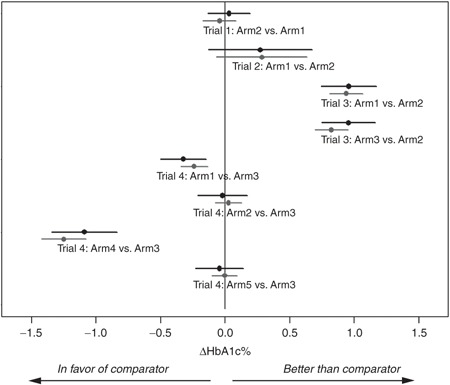
Overview of prediction performance in each arm. Abscissa presents the percentage change in HbA1c (ΔHbA1c) following 24–28 weeks of treatment compared with main comparator (see description in Table 1). Each line presents 95% confidence interval for treatment effect vs. comparator calculated from observations (black) and predictions from 12 weeks (gray). Dots present mean difference in ΔHbA1c between comparator and the specific arm.