Figure 1.
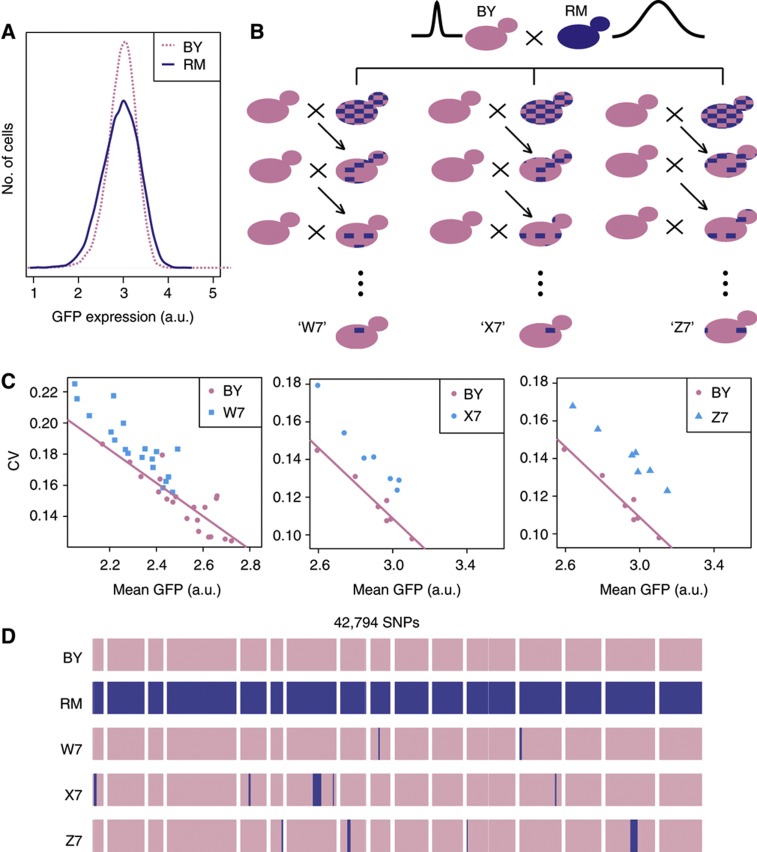
Genetic introgression of elevated cell–cell variability in gene expression. (A) Representative distributions of GFP expression levels obtained by flow cytometry on populations of BY cells (strain GY51, pink) and RM cells (strain GY601, blue). Fluorescent values were corrected for cell size as indicated in the Materials and methods. Note that strain GY601 did not carry the original ura3Δ0 mutation previously associated with elevated noise, which implies that the difference in variance is because of other sources of variability. (B) Introgression design. At every generation, a spore displaying elevated variability was backcrossed with BY. Blue patches denote remaining fractions of the genome originating from RM. (C) Characteristics of single-cell Pmet17-GFP expression in the three strains resulting from introgression. Strains GY51 (BY), W7, X7 and Z7 were cultured, induced at decreasing concentrations of methionine (see Materials and methods) and analyzed by flow cytometry. Each dot represents at least 10 000 cells. Pink line: linear model fitted on the BY samples. All three introgressed strains display elevated cell–cell variability as compared with BY. (D) Whole-genome resequencing of the final introgression strains. Each horizontal band represents one chromosome from 1 (left) to 16 (right). SNP positions are printed as vertical bars, in pink when their genotype is BY and in blue when genotype is RM.

