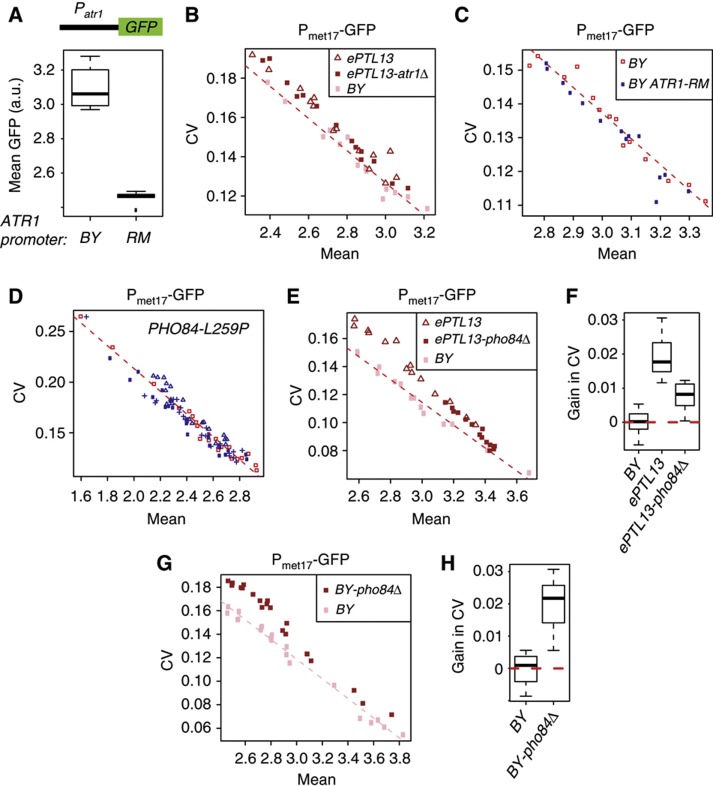
Figure 6.
Functional evaluation of ATR1 and PHO84 genes located at ePTL13. (A) The BY allele of ATR1 confers high promoter activity. The ATR1 promoter from BY was cloned upstream the GFP reporter, and the construct was integrated in a BY strain to produce independent transformants strains GY1325 and GY1326. The ATR1 promoter from RM was processed similarly to produce strains GY1327 and GY1328. All four strains were analyzed by flow cytometry in triplicates in the same experimental conditions as above (2 h at 50 μM methionine). (B) Deletion of ATR1 does not modify the contribution of ePTL13. Strains BY (pink squares, GY172), ePTL13 (brown triangles, GY915) and ePTL13-atr1Δ (filled brown squares, GY1309) were cultured in parallel, induced at decreasing concentrations of methionine and their level of GFP expression was analyzed by flow cytometry. Dashed red line: linear model of CV versus mean fitted to the BY samples. (C) No incidence of ATR1 allele replacement on Pmet17-GFP expression variability. Strain GY1330 (blue), isogenic to BY except for the ATR1 promoter that was replaced by the RM allele, was cultured in parallel of strain GY246 (red) and analyzed as in (B). (D) No incidence of PHO84-L259P polymorphism on Pmet17-GFP expression variability. Strains GY1306 (blue filled squares), GY1307 (blue triangles) and GY1308 (blue crosses) isogenic to BY except for the PHO84-L259P polymorphism were compared with BY strain GY172 (red) as in (B) and (C). (E) Deletion of PHO84 partly reduces the effect of ePTL13 and increases mean expression. Strain GY1310 (filled brown squares) carrying the ePTL13 locus from RM in which the PHO84 gene was deleted was compared with BY (GY51, pink squares) and to strain GY915 (brown triangles), which carried an intact ePTL13 locus from RM. Dashed red line: linear model of CV versus mean fitted to the BY samples. (F) Quantification of variability changes in response to pho84 deletion using the data presented in (E). Gains in CV were calculated as the deviations from the linear model fitted to BY samples. CV gains in ePTL13-pho84Δ were significantly reduced as compared with ePTL13 (Wilcoxon Mann–Whitney P=3.5 × 10⁻⁷) but remained significantly higher than BY (Wilcoxon Mann–Whitney P=7 × 10⁻⁶). (G) Deletion of PHO84 in the BY context increases Pmet17-GFP expression variability. Strain BY-pho84Δ (GY1296, brown squares) was compared with strain BY (GY51, pink squares) as in (B), (C) and (E). Dashed red line: linear model of CV versus mean fitted to the BY samples. (H) CV gains calculated on the data presented in (G). The increase in CV was highly significant (Wilcoxon Mann–Whitney P=3 × 10⁻¹¹).

