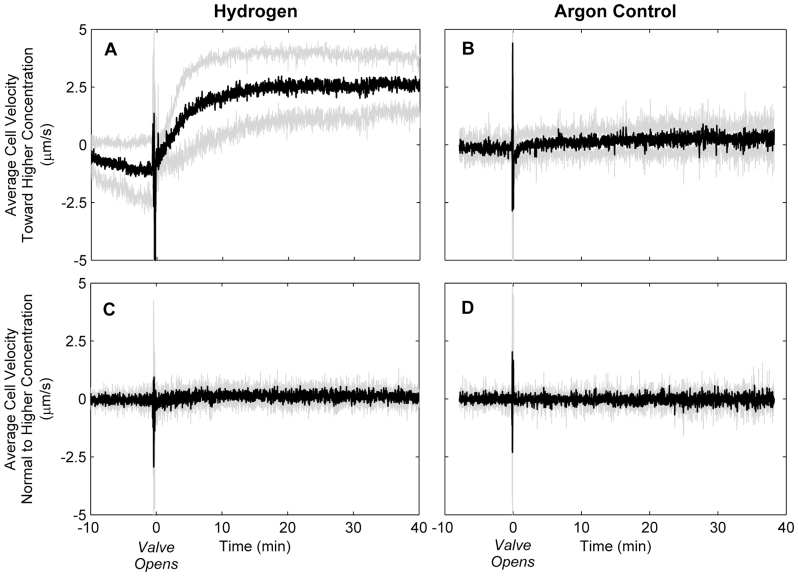
Figure 2. Average cell velocity (black) with 95% confidence intervals (gray) before and after opening valve to gas phase for (A) H2 and (B) Ar control.
Positive y-axis values indicate movement toward the gas phase, negative y-axis values indicate movement away from the gas phase. Average cell velocity (C) and (D) normal to concentration gradient (n = 5 for H2 and n = 3 for Ar).

