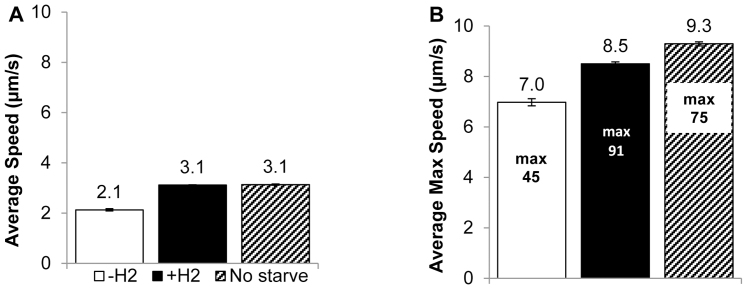
Figure 3. Swimming speed of M. maripaludis cells when starved for 5 hours before H2 exposure (−H2 and n = 4,725), after H2 exposure (+H2 and n = 20,189), and when not starved (No starve, n = 45,001).
Values represent the mean and error bars represent 95% confidence intervals. (A) Average swimming speed. The difference between –H2 and both +H2 and no starvation is significant (p < 0.05). (B) Average maximum swimming speeds are represented by bars, and absolute maximum values inside each bar represent the highest observed speed over all time points for the condition. Differences between all conditions are significant (p < 0.05) and p values were calculated with two-tailed t-tests.

