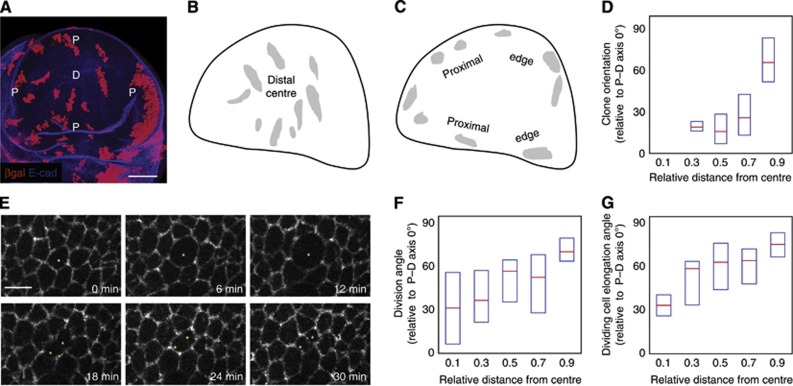
Figure 1.
Clone orientations and division orientations change along the P–D axis. (A) A wild-type (WT) wing disc containing clones expressing lacZ. D marks the distal (centre) of the wing disc and P marks the proximal ring (edge); scale=50 μm. The P–D axis during wing disc development is a radial axis. (B) Overlay of clones in the distal (centre) region from several wing discs. These are elongated along the P–D axis (radial). (C) Overlay of clones in the proximal (edge) region from several wing discs. These are elongated perpendicular to the P–D axis (circumferential). (D) The long axes of individual clones are oriented relative to the P–D axis at that position (perfect P–D alignment=0°) and plotted against relative distance from the centre to the first fold (edge) of the wing pouch. Box plots show median and first and third quartiles, n=119 clones, only clones with an elongation ratio of >1.25 are plotted. (E) Snapshots from a live-imaged Arm::GFP wing disc, scale=5 μm. 0 min shows the dividing cell (marked by an asterisk) immediately prior to mitosis. At 30 min, cytokinesis has completed and the two daughter cells are formed. (F) The alignment of the two daughter cells immediately after mitosis in live-imaged discs is oriented relative to the P–D axis and plotted against its relative distance from the centre to the first fold of the pouch. Box plots show median and first and third quartiles, n=110 dividing cells. Only mother cells with elongation ratios (long/short axis)>1.3 are plotted. (G) The long axis of each dividing cell immediately prior to mitosis in live-imaged discs is oriented relative to the P–D axis and plotted against its relative distance from the centre to the first fold (edge) of the pouch. Box plots show median and first and third quartiles, n=110 dividing cells. Only cells with elongation ratios (long/short axis)>1.3 are plotted.

