Figure 5.
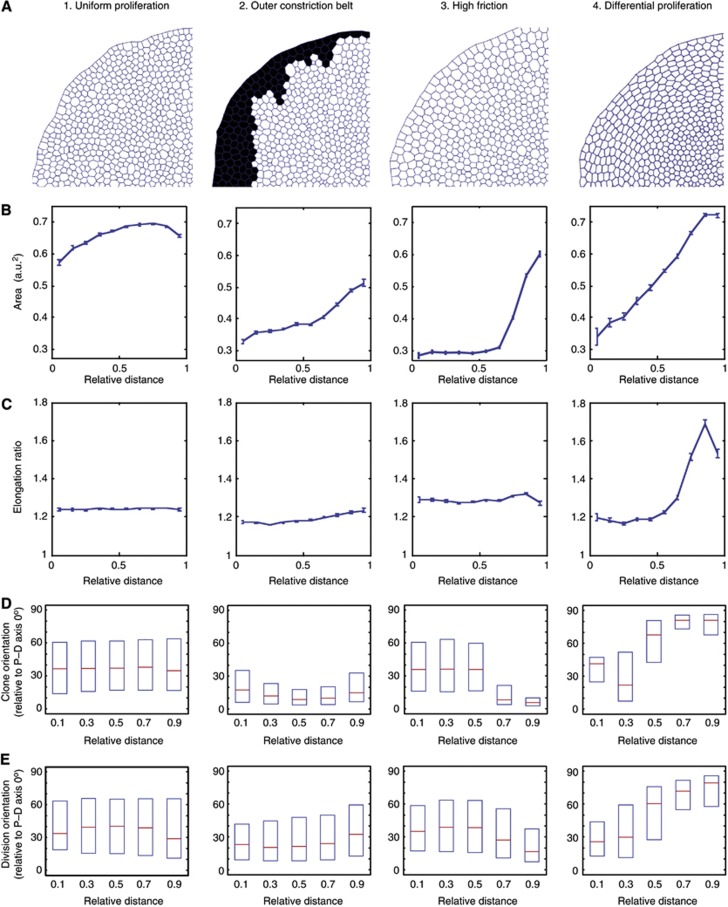
Computational exploration of the different mechanisms that can generate global forces to elongate cells in the periphery of the disc. A radial (P–D) polarization of Dachs is applied to all simulations to mimic the in vivo Dachs polarization patterns. (A) Snapshots of a quadrant of the in silico wing discs after ‘60 h real time’ simulations (equivalent to between 2 and 10 h computational run time, depending on scenario). (B–E) All graphs show relative distance from the centre of the disc on the X axis. (B) Cell area (arbitrary units) at end point. Error bars represent s.e.m. (C) Cell elongation ratios at end point. Error bars represent s.e.m. (D) Clones are induced in silico and their elongation orientations (relative to the radial P–D axis) are recorded at end point. Plots show median and first and third quartiles. Note the baseline bias of orientations towards the P–D axis, due to Dachs. (E) Cell division orientations are tracked throughout the run. Showing median and first and third quartiles. See Supplementary Figure S6 for detailed analysis of cell elongation orientations. The profile of the steep differential proliferation in mechanism (4) is shown in Supplementary Figure S6D, top panel.

