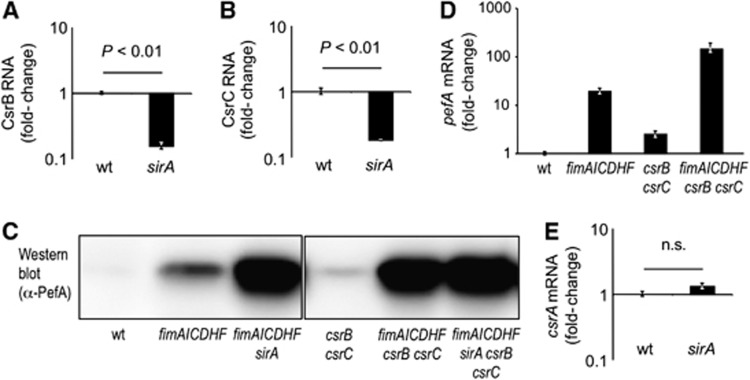
Figure 2.
SirA represses expression of PefA via downregulation of CsrB and CsrC. Expression of CsrB RNA (A) and CsrC RNA (B) was quantified by real-time PCR using RNA isolated from S. typhimurium wild type (wt) and the sirA mutant (sirA). Bars represent the average of four independent experiments ±standard error. (C) Expression of PefA was detected in cell lysates of the indicated strains using western blot. (D) Relative expression of pefA transcripts was assessed in RNA isolated from the indicated bacterial strains by real-time PCR. Bars represent the average of three independent experiments ±standard error. (E) Expression of csrA mRNA was quantified by real-time PCR using RNA isolated from the indicated strains. Bars represent the average of four independent experiments ±standard error. Statistical analysis was performed by a Student’s t-test.
Source data for this figure is available on the online supplementary information page.

