Figure 5.
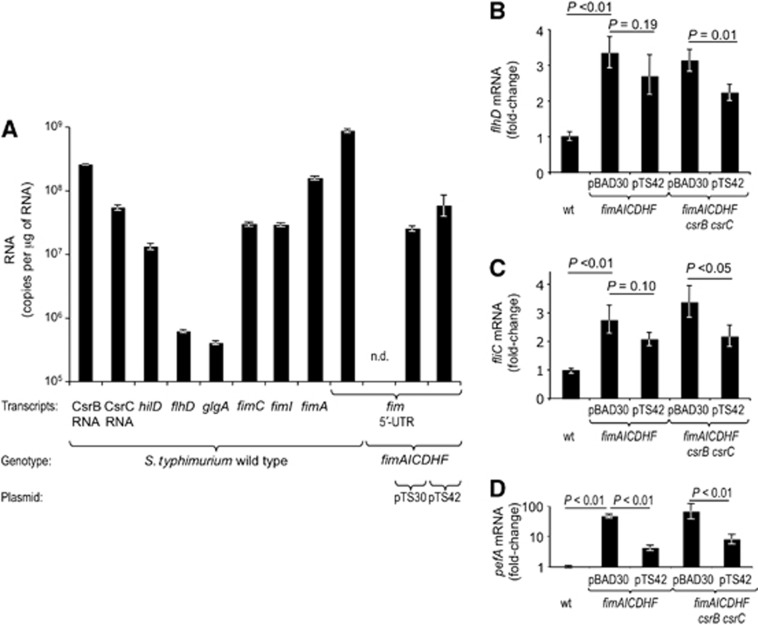
The 5′-UTR of the fimA transcript regulates gene expression. RNA was isolated from the indicated bacterial strains grown in LB5.5. (A) Absolute copy numbers of the indicated transcript per microgram of total RNA were determined by quantitative real-time PCR for the indicated transcripts. (B–D) Relative changes in transcript levels were determined by quantitative real-time PCR for the indicated transcripts. Bars represent geometric means±standard error from three (A) or six (B–D) different experiments. Statistical analysis was performed by a Student’s t-test and statistical significance of differences is indicated by brackets. ND, none detected.

