Figure 4.

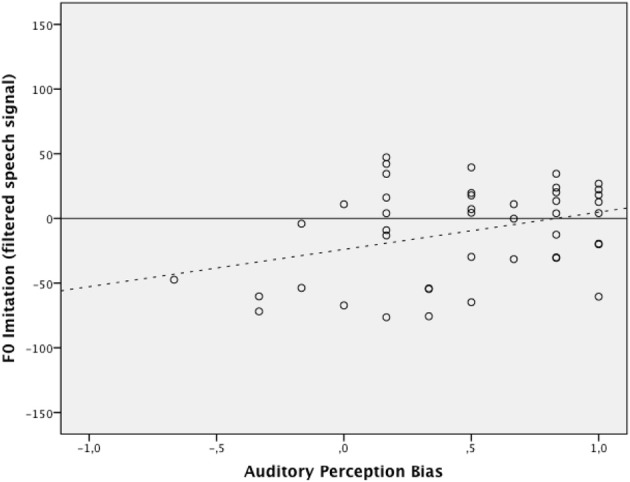
The relation between auditory perception bias above 1000 Hz and the degree of F0 imitation in the condition with filtered signal (dotted line indicating trend). The x- and y-axis represent the same measures as in Figure 3.

The relation between auditory perception bias above 1000 Hz and the degree of F0 imitation in the condition with filtered signal (dotted line indicating trend). The x- and y-axis represent the same measures as in Figure 3.