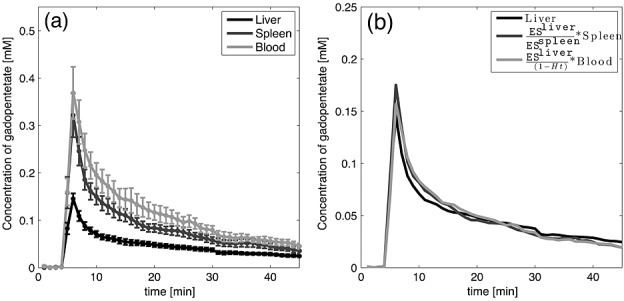
Figure 3.

(a) Concentration of gadopentetate in liver, spleen and blood; solid lines represent the mean concentration and the bars the SEM over the five animals. (b) Concentration of gadopentetate in ES in liver, equivalent signal scaled from the spleen data and, for reference, the equivalent signal scaled from blood data.
