
Figure 5.
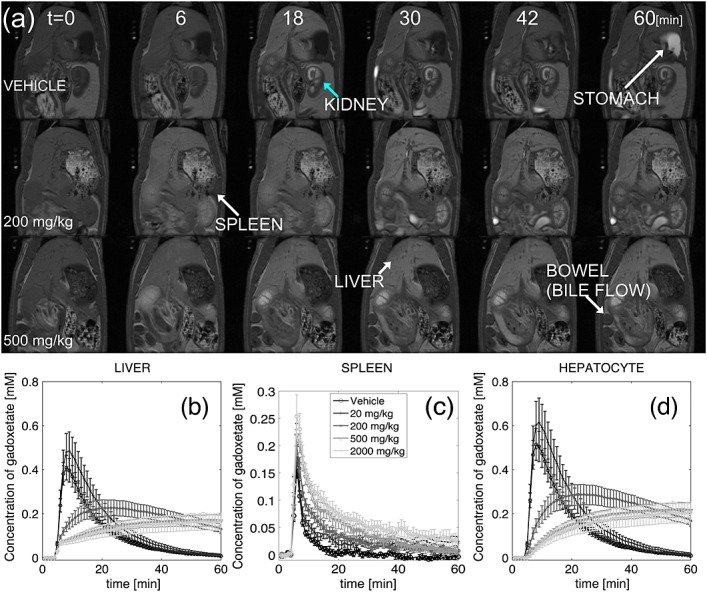
(a) Examples of dynamic images for animals treated with vehicle (top), 200 mg/kg (middle) or 500 mg/kg (bottom) CKA at t = 0, 6, 18, 30, 42 and 60 min after contrast injection. Note the enhancement of the small bowel lumen at about 30 min after contrast injection and also the reflux of gadoxetate into the stomach at the end of the acquisition in the vehicle treated animal. No enhancement was observed in the bowel of the animal treated with 500 mg/kg CKA. (b)–(d) Mean concentration of gadoxetate over ROIs covering (b) liver, (c) spleen and (d) hepatocytes. Bars represent SEM.