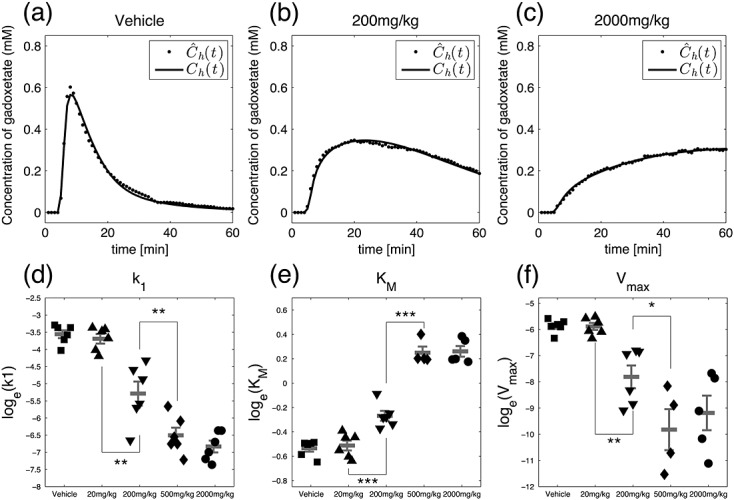
Figure 6.

(a)–(c) Output of the pharmacokinetic model of hepatic clearance of gadoxetate (solid line) compared with the actual data extracted from the MR images (dotted line) for three representative animals treated with (a) vehicle, (b) 200 mg/kg CKA or (c) 500 mg/kg CKA. (d)–(f) Parameters of the model for individual animals in each group: (d) rate of uptake into the hepatocyte, k1, (e) rate of efflux into bile, Vmax, and (f) Michaelis–Menten constant, KM. Each symbol represents an individual animal; mean ± SEM is also given for each group. Significance codes: *** p < 0.001, ** p < 0.01, * p < 0.05.
