
Figure 8.
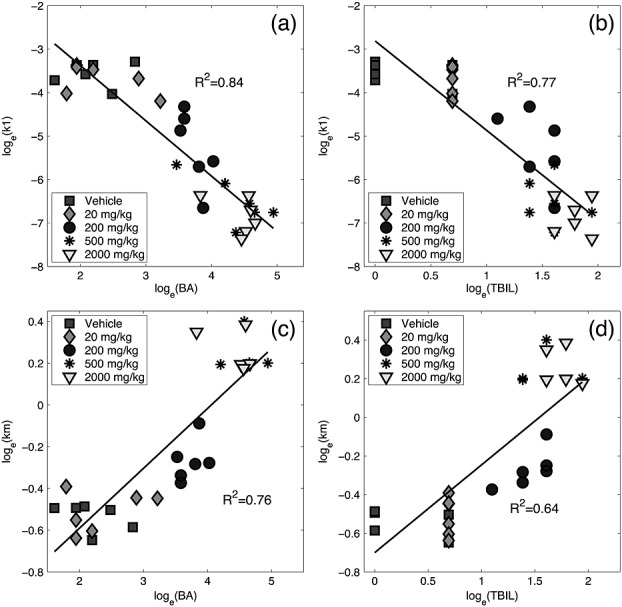
(a, b) Correlation of gadoxetate k1 and plasma marker concentrations of (a) total bile acids, BA, and (b) total bilirubin, TBIL. (c, d) Correlation of gadoxetate KM and plasma marker concentrations of (c) total bile acids, BA, and (d) total bilirubin, TBIL. Each symbol represents an individual animal.