
Fig. 4.
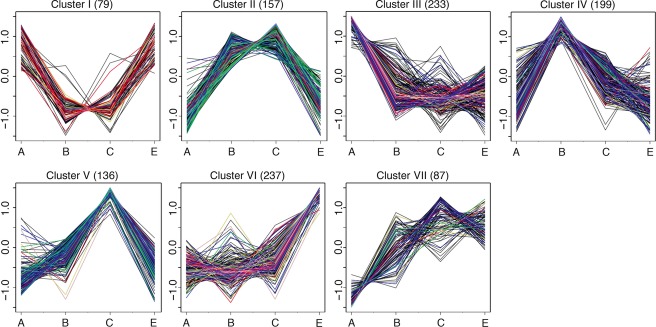
Seven clusters representing the expression patterns of the differentially expressed unigenes clustered using PAM. The numbers in parentheses represent the number of unigenes in the cluster. A, B, C and E on the x-axis correspond to the time points of sampling. The expression of each unigene (y-axis) was scaled to a mean of 0 and a standard deviation of 1 across the four samples. Each line indicates the expression pattern of each unigene. Gene categories are represented by different colours: genes upregulated by decreasing ambient temperature (green), stress conditions (yellow), JA (pink) and increased sucrose level (blue); genes downregulated by prolonged moderate drought conditions (red), GA (purple), carbon-limitation conditions (light blue) and others (black).