Figure 6.
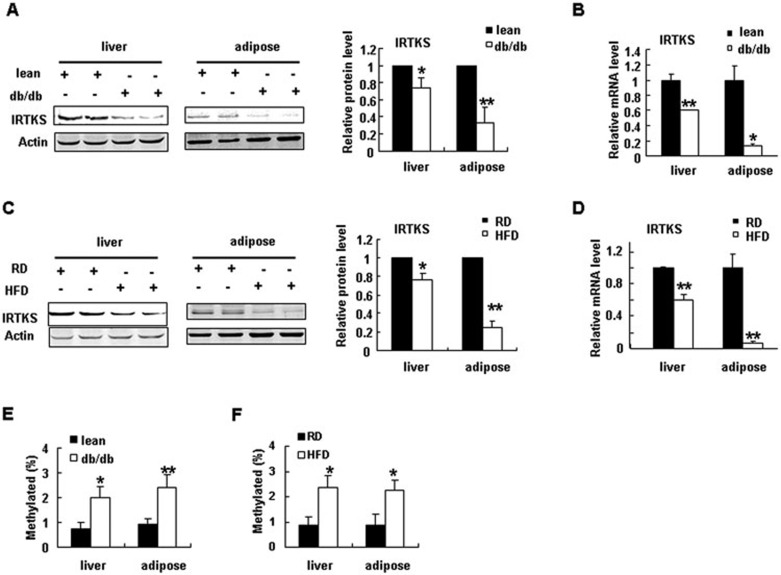
IRTKS downregulation and DNA hypermethylation in diabetic mice. (A, B) IRTKS expression in liver and adipose tissue of db/db mice and lean mice (n = 5 or 6) determined by western blotting (A) and real-time PCR (B). (C, D) IRTKS expression in liver and adipose tissue of C57BL/6 mice fed with a high-fat diet (HFD) and regular diet (RD) (n = 5) determined by western blotting (C) and real-time PCR (D). (E, F) DNA methylation levels of the CpG island near the transcription start site (TSS) of IRTKS in livers and adipose tissue from db/db mice (n = 3) (E) and HFD-induced obese mice (n = 2) (F). Data are presented as the mean ± sem. *P < 0.05, **P < 0.01 versus control.

