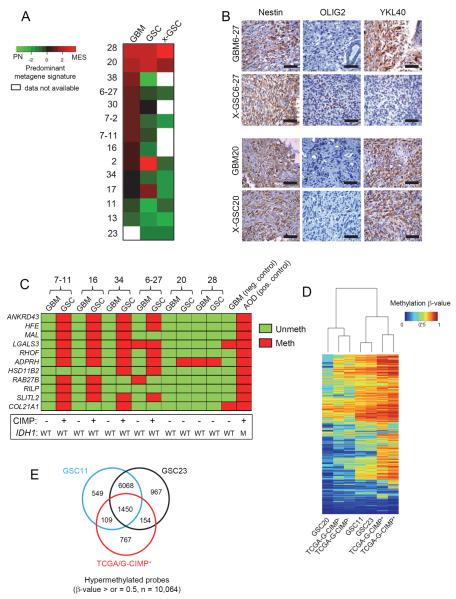
Figure 2. GSCs Differ in the Transcriptome and Epigenetic Profiles When Compared to the Originating Tumor.
(A) Heatmap of the predominant signature of initiating GBM, derived GSC, and xenograft for fourteen samples is shown. A PN and MES qRT-PCR based metagene was calculated for each sample and then compared to each other after Z-score correction. Green shades represent a predominantly PN signature, red a MES one, and black a relatively balanced expression of both, as indicated in the figure. (B) IHC analysis of Nestin, OLIG2 and YKL40 expression in patient matched GBM and xenografts of GSCs. Scale Bar: 50 μm. (C) Methylight profiling of GBMs and their derivative GSCs for G-CIMP status. Eleven markers were tested for presence of methylation on their promoters and coded as red if methylated and green if unmethylated. Samples were deduced as G-CIMP if >50% of the loci showed methylation. A GBM and an anaplastic oligodendroglioma (AOD) sample were used as negative and positive controls respectively. The IDH1 and G-CIMP status of all samples is shown below. (D) Heatmap shows the unsupervised clustering of 2612 G-CIMP signature methylation probes based on p values for the indicated cell types. (E) Venn diagram showing the number of hypermethylated probes (β-values of >0.5) in GSCs 11, 23 and TCGA G-CIMP+ tumors. See also Figure S2.

