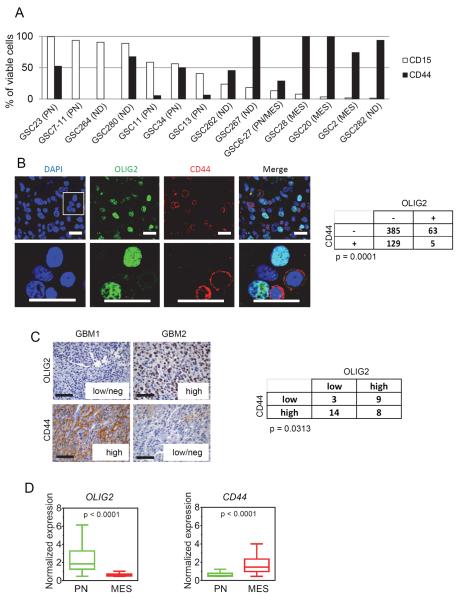
Figure 3. CD44 is Enriched in the MES Subtype and is Inversely Correlated with OLIG2 Expression.
(A) CD15 and CD44 of various GSCs were determined by flow cytometry. Bar graph indicates percentage of viable cells that express these markers at the earliest passage tested. ND = not determined. (B) Immunofluorescent staining of OLIG2 (green) and CD44 (red) in human GBM tumors showing a mutually exclusive pattern of staining. Scale bar: 20 μm. The merged image of CD44/OLIG2 is shown on the right against 4',6-diamidino-2-phenylindole (DAPI) stained nuclei (blue). Enlarged inset is shown in the lower panel (scale bar: 20 μm). Quantification of staining in three random fields of three independent tumors and the p value from Chi Square test is shown on the right. (C) Representative IHC images of OLIG2 and CD44 expression in human GBM samples. Scale bar: 50 μm. The table to the right shows the number of tumors expressing OLIG2/CD44. Tumors were classified as low/negative, intermediate, or high depending on the extent of expression in the overall tumors. p value was calculated using Chi Square test. (D) Box plots showing the normalized median expression of OLIG2 and CD44 in TCGA tumors based on Phillips and TCGA classification. Boxes show median 25th and 75th percentile, while whiskers show the 5th and the 95th percentile. p value was determined using a non-parametric Wilcoxon test. See also Figure S3.

