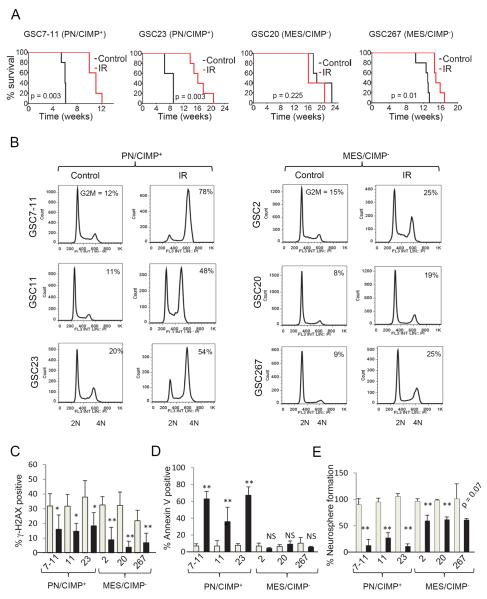
Figure 4. PN/CIMP+ and MES/CIMP− GSCs Display Differential Sensitivity to Radiation.
(A) Kaplan Meier curves showing survival of mice implanted with PN/CIMP+ (7–11 and 23) or MES/CIMP− (20 and 267) GSCs at 5 × 10⁵ cells per mice with or without fractioned intracranial radiation (2.5 Gy × 4). t test was used to assess statistical significance. (B) Cell cycle analysis of GSCs treated with 6 Gy IR. The percentage of cells in the G2/M phase is indicated within each cell cycle plot. (C) γ-H2AX foci formation assay. Gray bars indicate number of foci after 6 h irradiation whereas black bars show foci after 24 h. At least 25 nuclei were counted. Error bar indicates +/− SEM. t test was used to assess statistical significant differences. *p < 0.05, **p < 0.005 (D) Percentage of cells that were positive for annexin V staining 96 hours post irradiation is shown as bar graphs. Gray bars indicate percentage of cells in untreated population whereas black bars show percentage of annexin V positive cells exposed to 6 Gy IR. Error bar indicates +/− SD. t test was used for statistical significance. **p < 0.005, NS = not significant (E) Neurosphere formation efficiency was determined by setting the number of spheres formed in control groups at 100% (gray bars) and compared to those exposed to 3 Gy IR (black bars). Error bar indicates +/− SD. t test was used for statistical significance. **p < 0.005. See also Figure S4.

