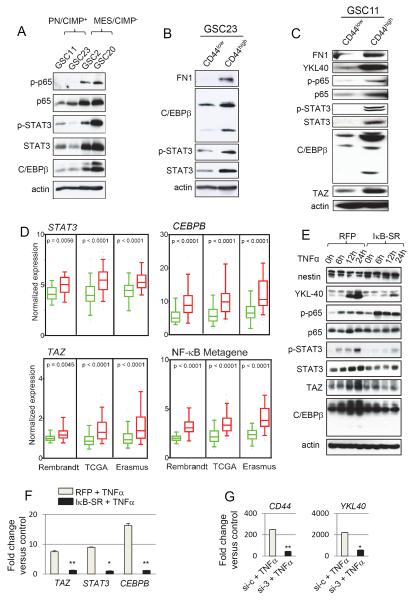
Figure 6. NF-κB Controls Master TFs of MES Differentiation in GSCs.
(A) Western blot analysis of phosphorylated p65 (ser 536), total p65, phosphorylated STAT3 (Tyr 705), STAT3 and C/EBPβ in GSCs. (B) and (C) Western blot analysis using indicated antibodies were performed on GSC23 and 11 sorted for CD44high or CD44low subpopulations. (D) Box plots of normalized expression of STAT3, CEBPB, TAZ, and NF-κB metagene in CD44low (green boxes) or CD44high (red boxes) tumors from multiple datasets as indicated. Boxes show median 25th and 75th percentile, while whiskers represent the 5th and the 95th percentile. Outliers are shown as individual points. p value was determined using a non-parametric Wilcoxon test. For the NF-κB metagene, the average expression of 38 NF-κB family members and targets (see Supplemental Experimental Procedures) was condensed into a metagene and plotted. Wilcoxon signed-rank test was used to test statistical significance. (E) Time course western blot analysis of indicated antibodies after TNFα treatment in GSC11 transduced with RFP or IκB-SR adenovirus 24 h prior to TNFα treatment. (F) qRT-PCR analysis of MES signature master TFs STAT3, CEBPB and TAZ in GSC11 treated with TNFα with or without pre-treatment with RFP or IκBSR adenovirus. Error bar indicates +/− SD. t test was used for statistical significance. *p < 0.05 and **p < 0.005. (G) qRT-PCR analysis of YKL40, and CD44 after knockdown of all three master TFs (STAT3, C/EBPβ and TAZ) in GSC11 is shown. Cells were treated with siRNA 72 h prior to treatment with TNFα for an additional 24 h. Error bar indicates +/− SD. t test was used for statistical significance. *p < 0.05 and **p < 0.005. See also Figure S6.

