
Figure 1.
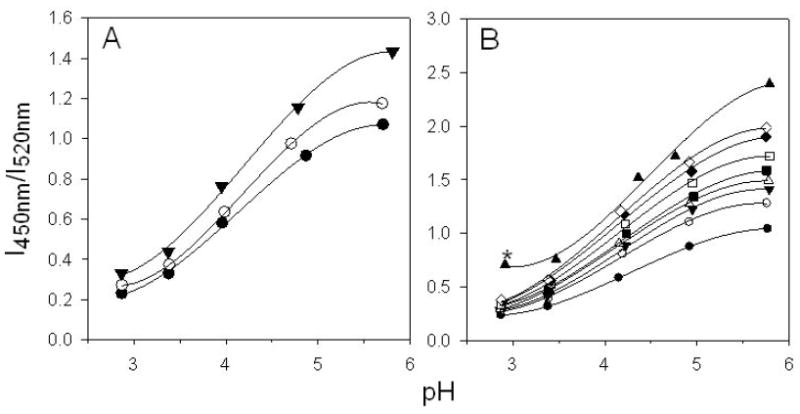
Interference of confocal pH measurement of Lysosensor yellow/blue® dextran as a function of pH (A) by the presence of 100 mg/ml of BSA (▼), 100 mg/ml of lysozyme (○), or absence of protein (●); (B) by the presence of BSA at the concentration of 0 mg/ml (●), 25 mg/ml (○), 50 mg/ml (▼), 75 mg/ml (△), 100 mg/ml (■), 150 mg/ml (□), 200 mg/ml (◆), 250 mg/ml (◇), and 500 mg/ml (▲). The concentration of fluorescence dye was 1.2 mg/ml. Lines represent best fits to a third order polynormial function of the experimental data. SD for all data points were less than 2% of mean (n=8). * BSA formed a gel-like phase at this protein concentration and pH.