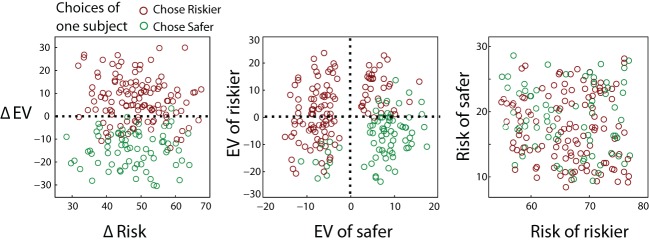
Figure 3.

Trials were chosen to give a spread of expected values (EVs) and a spread of risks. One gamble always had a high risk, and the other a low risk. On some trials the choice was easy (small EV difference), on others it was hard (large EV difference). Colors demonstrate the choice on each trial for one representative participant, showing near-optimal choice.
