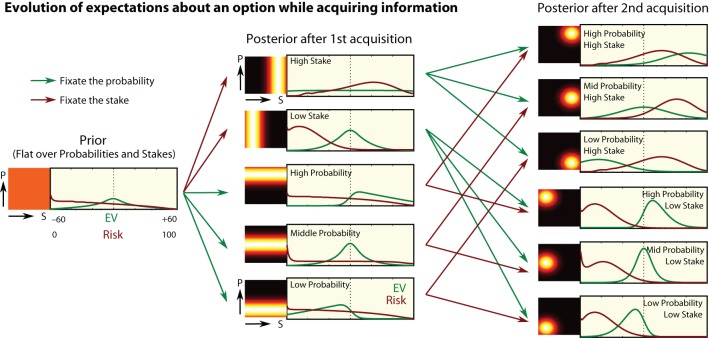
Figure 7.
Bayesian updating of expectations. What information is obtained in the first two acquisitions? Heatmaps on the left of each panel illustrate the participant's estimated distribution of probability and stake. From this we calculate the estimated distribution of EVs and Risks Equations (6) and (7). Far left: the priors give a relatively flat distribution for EV and risk. First column: after the first acquisition, either a probability or stake is seen, narrowing the distribution in that dimension, and altering the density of EV and risk. Second column: after the first acquisition, the participant shifts attention to the other value in the same option, and his estimate of EV and risk improves again. As more information is accrued by fixations, the distributions become more peaked.

