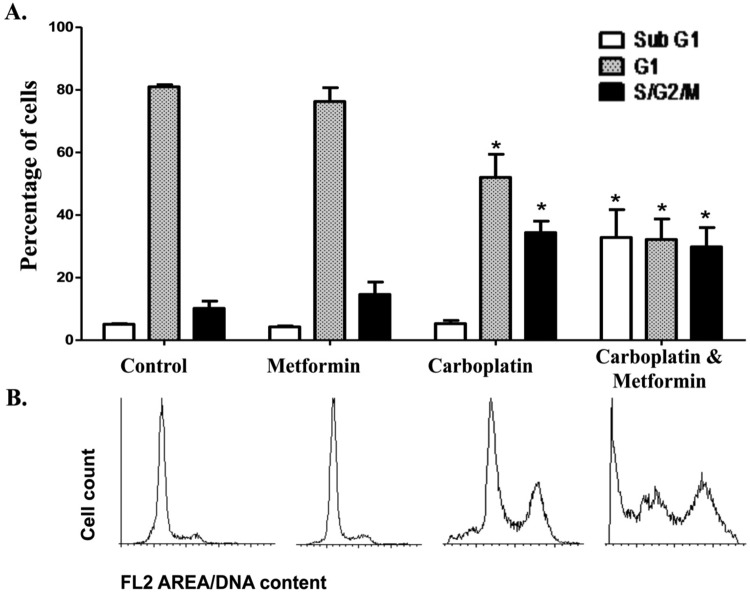
Figure 4.
Changes in cell cycle upon the combination of metformin and carboplatin. A, Graphical representation of cell cycle analysis by flow cytometry in the A2780 cell line incubated with vehicle (control), metformin (20 µmol/L), carboplatin (10 µmol/L), or the combination of metformin and carboplatin for 48 hours. The sub-G0/G1 population has been previously confirmed to correspond to cell death in this cell line with chemotherapy.23,24 Graphs show the means of 3 independent experiments, each of 5 replicates. P < .05 was considered as significant. B, Images of flow cytometry analysis shown in (A).

