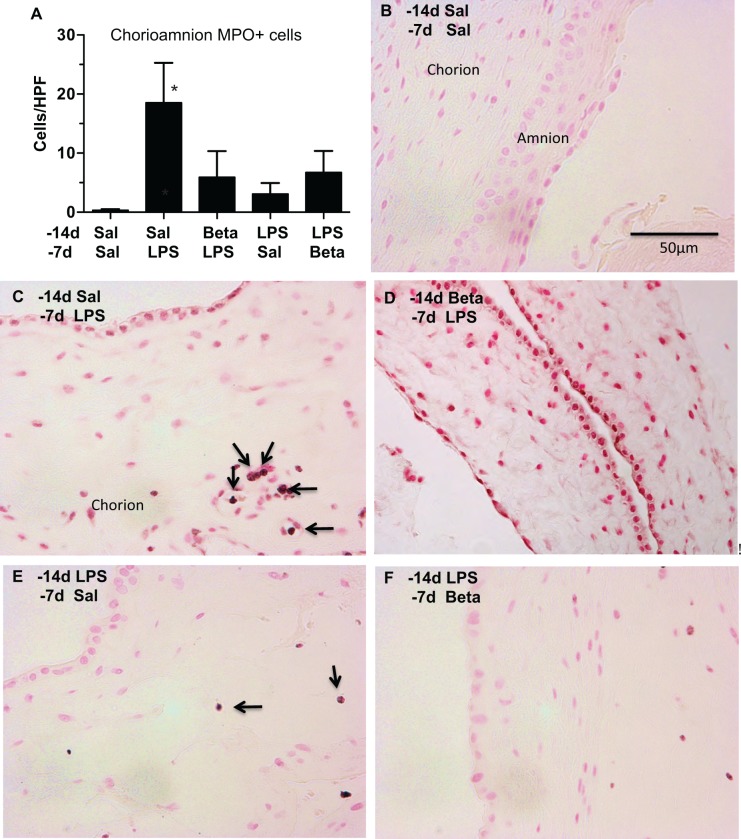
Figure 2.
Myeloperoxidase (MPO) expression in inflammatory cells after maternal β-methasone (β) and intra-amniotic lipopolysaccharide (LPS; A). Mean MPO-expressing cells per microscopic field are shown for the different groups. Representative photomicrographs of MPO immunostaining are shown for (B) Saline 14 days/Saline 7 days (control), (C) Saline14 days/LPS 7 days, (D) β 14 days/LPS 7 days, (E) LPS 14 days/Saline 7 days, and (F) LPS 14 days/β 7 days groups. Arrows point to MPO-expressing cells. N = 4-6 animals/group, scale bar (B) represents 50 µm, *P < .05 versus Saline 14 days/Saline 7 days.

