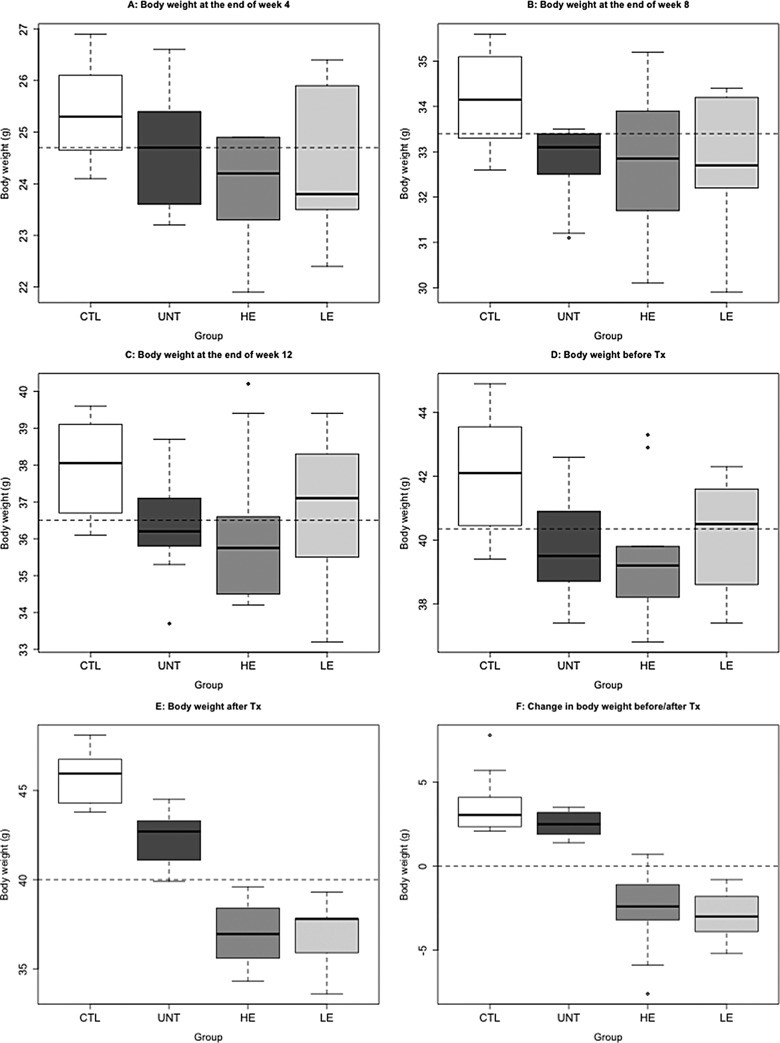
Figure 2.
Box plots of body weight measured at different time points among different groups of mice. A, Body weight measured at the end of week 4 after birth; (B) body weight measured at the end of week 8 after birth; (C) body weight measured at the end of week 12 after birth; (D) body weight measured at the end of week 16 after birth or right before the drug treatment (Tx); (E) body weight measured at the end of the 3-week long drug treatment; (F) change in body weight between before and after treatment. The dashed line in each figure represents the median of all mice. CTL indicates mice without adenomyosis; UNT, mice induced with adenomyosis but received no treatment; LE, mice induced with adenomyosis that received low-dose EGCG treatment; HE, mice with induced adenomyosis that received high-dose EGCG treatment; EGCG, epigallocatechin-3-gallate.

