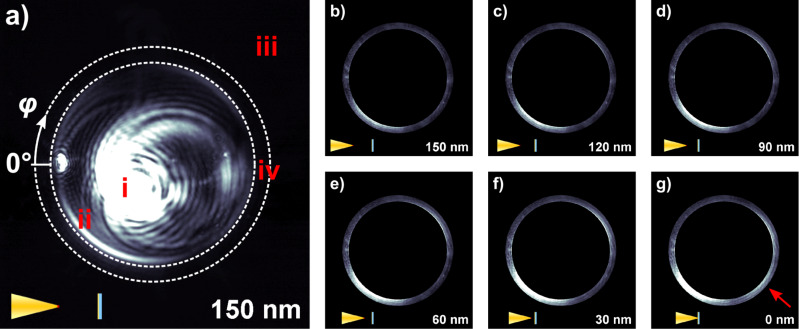
Figure 4.
k-space patterns recorded while approaching a gold-coated cover slip to the SNOM probe. Tip-sample spacings are indicated in the lower right corner of the respective images and the corresponding pictographs in the lower left corner. Panel a) shows raw data, the dashed circles mark the region of interest (ROI, labeled iv). Panels b)-g) represent the evolution of the k-space pattern during approach. For clarity, the data are limited to the ROI and are rescaled to the 90th percentile of all pixel intensities within the ROI in panel g).

