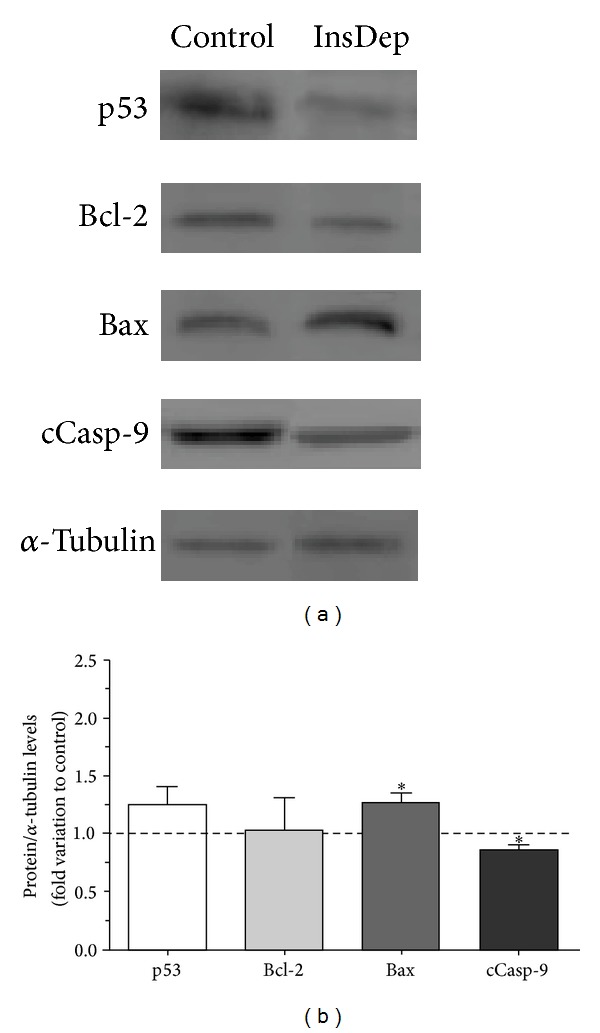
Figure 2.

Effect of insulin deprivation on p53, Bcl-2, Bax, and cleaved caspase-9 protein levels in rat Sertoli cells. (a) shows representative western blot experiment. (b) displays pooled data of independent experiments, indicating the fold variation of protein levels found in rat SCs cultured in insulin deprivation conditions (InsDep) when compared with the control condition (dashed line). Results are expressed as mean ± SEM (n = 5 for each condition). Significantly different results (P < 0.05) are indicated: *relatively to control.
